SCI图片复现:GO柱状图-不同色彩分组
我们需要一个CSV文件,其中至少包含三列数据:'Description','Count' 和 'Cluster'。'Description' 是对项目的描述,'Count' 是相应的计数,'Cluster' 是用来指定分组或颜色的列。
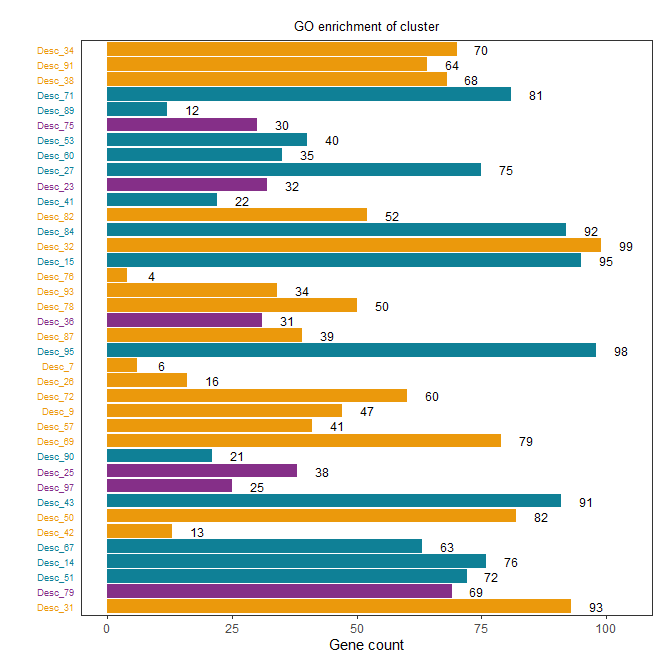
让我们首先创建一个满足这些需求的模拟数据框,并打印出前几行,然后展示示例代码:
# 确保加载必要的包
library(ggplot2)
library(forcats)

# 设置随机种子,确保结果可复现
set.seed(123)

# 生成随机的Description, Count和Cluster
Description <- paste0("Desc_", sample(1:100, 38))
Count <- sample(1:100, 38)
Cluster <- sample(c('Cluster1', 'Cluster2', 'Cluster3'), 38, replace = TRUE)

# 创建数据框
A <- data.frame(Description, Count, Cluster)

# 打印出前几行数据
head(A)

# 按照描述的顺序将描述转化为因子
A$Description <- fct_inorder(A$Description)

# 创建颜色映射以匹配簇标签
color_map <- c('Cluster1' = '#852f88', 'Cluster2' = '#eb990c', 'Cluster3' = '#0f8096')

# 创建新的颜色列
A$Color <- color_map[A$Cluster]

# 使用这些颜色创建基于簇的柱状图,并将计数标签添加到柱状图上
p <- ggplot(A, aes(Description, Count)) +
  geom_bar(aes(fill = Cluster), stat = "identity") +
  geom_text(aes(label = Count, y = Count + 5), size = 3) +
  coord_flip() +
  labs(x = '', y = 'Gene count', title = 'GO enrichment of cluster') +
  scale_fill_manual(values = color_map) +
  theme_bw() +
  theme(panel.grid = element_blank(),
        legend.position = 'none',
        axis.ticks.y = element_blank(),
        plot.title = element_text(hjust = 0.5, size = 10),
        axis.text.y = element_text(size = rel(0.85), colour = A$Color),
        plot.margin = unit(c(0.2, 0.2, 0.2, 0.2), units = "inches"))

# 打印出图像
print(p)

# 将结果保存为PDF和CSV文件
ggsave("GO_enrichment.pdf", p, width = 10, height = 7)
write.csv(A, "GO.csv", row.names = FALSE)
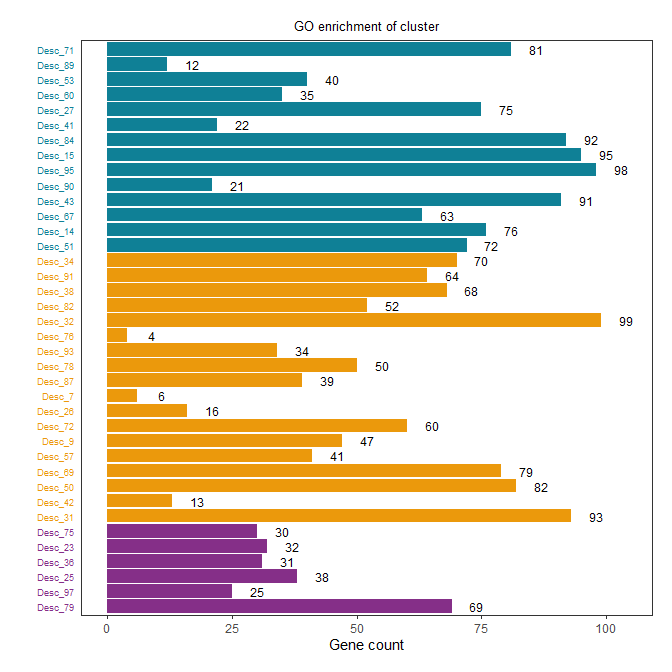
进一步优化,使得同颜色在一起
# 确保加载必要的包
library(ggplot2)
library(forcats)
library(dplyr)

# 设置随机种子,确保结果可复现
set.seed(123)

# 生成随机的Description, Count和Cluster
Description <- paste0("Desc_", sample(1:100, 38))
Count <- sample(1:100, 38)
Cluster <- sample(c('Cluster1', 'Cluster2', 'Cluster3'), 38, replace = TRUE)

# 创建数据框并按Cluster排序
A <- data.frame(Description, Count, Cluster) %>%
  arrange(Cluster)

# 打印出前几行数据
head(A)

# 按照描述的顺序将描述转化为因子
A$Description <- fct_inorder(A$Description)

# 创建颜色映射以匹配簇标签
color_map <- c('Cluster1' = '#852f88', 'Cluster2' = '#eb990c', 'Cluster3' = '#0f8096')

# 创建新的颜色列
A$Color <- color_map[A$Cluster]

# 使用这些颜色创建基于簇的柱状图,并将计数标签添加到柱状图上
p <- ggplot(A, aes(Description, Count)) +
  geom_bar(aes(fill = Cluster), stat = "identity") +
  geom_text(aes(label = Count, y = Count + 5), size = 3) +
  coord_flip() +
  labs(x = '', y = 'Gene count', title = 'GO enrichment of cluster') +
  scale_fill_manual(values = color_map) +
  theme_bw() +
  theme(panel.grid = element_blank(),
        legend.position = 'none',
        axis.ticks.y = element_blank(),
        plot.title = element_text(hjust = 0.5, size = 10),
        axis.text.y = element_text(size = rel(0.85), colour = A$Color),
        plot.margin = unit(c(0.2, 0.2, 0.2, 0.2), units = "inches"))

# 打印出图像
print(p)

# 将结果保存为PDF和CSV文件
ggsave("GO_enrichment.pdf", p, width = 10, height = 7)
write.csv(A, "GO.csv", row.names = FALSE)
在这个修改后的版本中,我们添加了一个新的步骤,用dplyr的arrange()函数将数据框A按照Cluster进行排序。现在,相同颜色的条形将被放在一起。
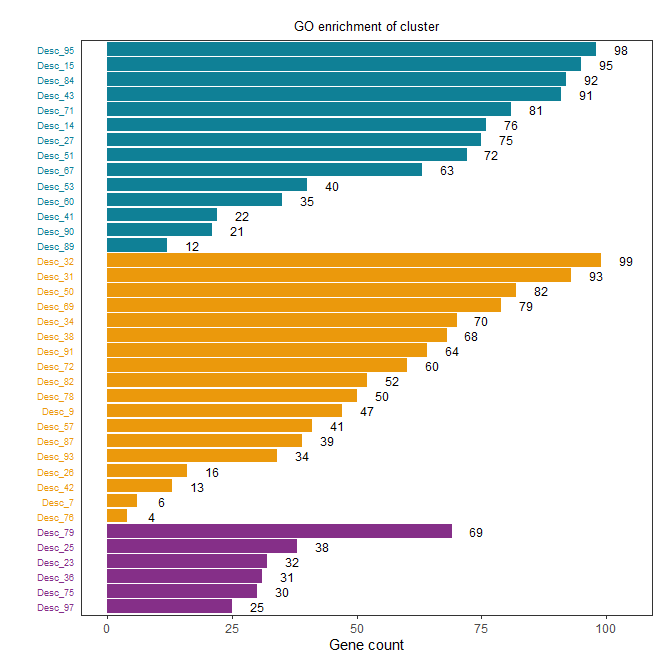
继续优化,使同颜色分组在一起同时按柱长短排布
# 确保加载必要的包
library(ggplot2)
library(forcats)
library(dplyr)

# 设置随机种子,确保结果可复现
set.seed(123)

# 生成随机的Description, Count和Cluster
Description <- paste0("Desc_", sample(1:100, 38))
Count <- sample(1:100, 38)
Cluster <- sample(c('Cluster1', 'Cluster2', 'Cluster3'), 38, replace = TRUE)

# 创建数据框并按Cluster排序,然后在每个Cluster中按Count排序
A <- data.frame(Description, Count, Cluster) %>%
  arrange(Cluster, Count)

# 打印出前几行数据
head(A)

# 按照描述的顺序将描述转化为因子
A$Description <- fct_inorder(A$Description)

# 创建颜色映射以匹配簇标签
color_map <- c('Cluster1' = '#852f88', 'Cluster2' = '#eb990c', 'Cluster3' = '#0f8096')

# 创建新的颜色列
A$Color <- color_map[A$Cluster]

# 使用这些颜色创建基于簇的柱状图,并将计数标签添加到柱状图上
p <- ggplot(A, aes(Description, Count)) +
  geom_bar(aes(fill = Cluster), stat = "identity") +
  geom_text(aes(label = Count, y = Count + 5), size = 3) +
  coord_flip() +
  labs(x = '', y = 'Gene count', title = 'GO enrichment of cluster') +
  scale_fill_manual(values = color_map) +
  theme_bw() +
  theme(panel.grid = element_blank(),
        legend.position = 'none',
        axis.ticks.y = element_blank(),
        plot.title = element_text(hjust = 0.5, size = 10),
        axis.text.y = element_text(size = rel(0.85), colour = A$Color),
        plot.margin = unit(c(0.2, 0.2, 0.2, 0.2), units = "inches"))

# 打印出图像
print(p)

# 将结果保存为PDF和CSV文件
ggsave("GO_enrichment.pdf", p, width = 10, height = 7)
write.csv(A, "GO.csv", row.names = FALSE)
在这个修改后的版本中,我们在arrange()函数中同时指定了"Cluster"和"Count",这样数据就会先按照"Cluster"进行分组,然后在每个分组中按照"Count"的大小进行排序。这样,相同颜色的条形将被放在一起,并且在每个颜色组中,条形将按照大小进行排序。
阅读剩余
版权声明:
作者:
链接:https://yunshangtulv.com.cn/?p=488
文章版权归作者所有,未经允许请勿转载。
THE END