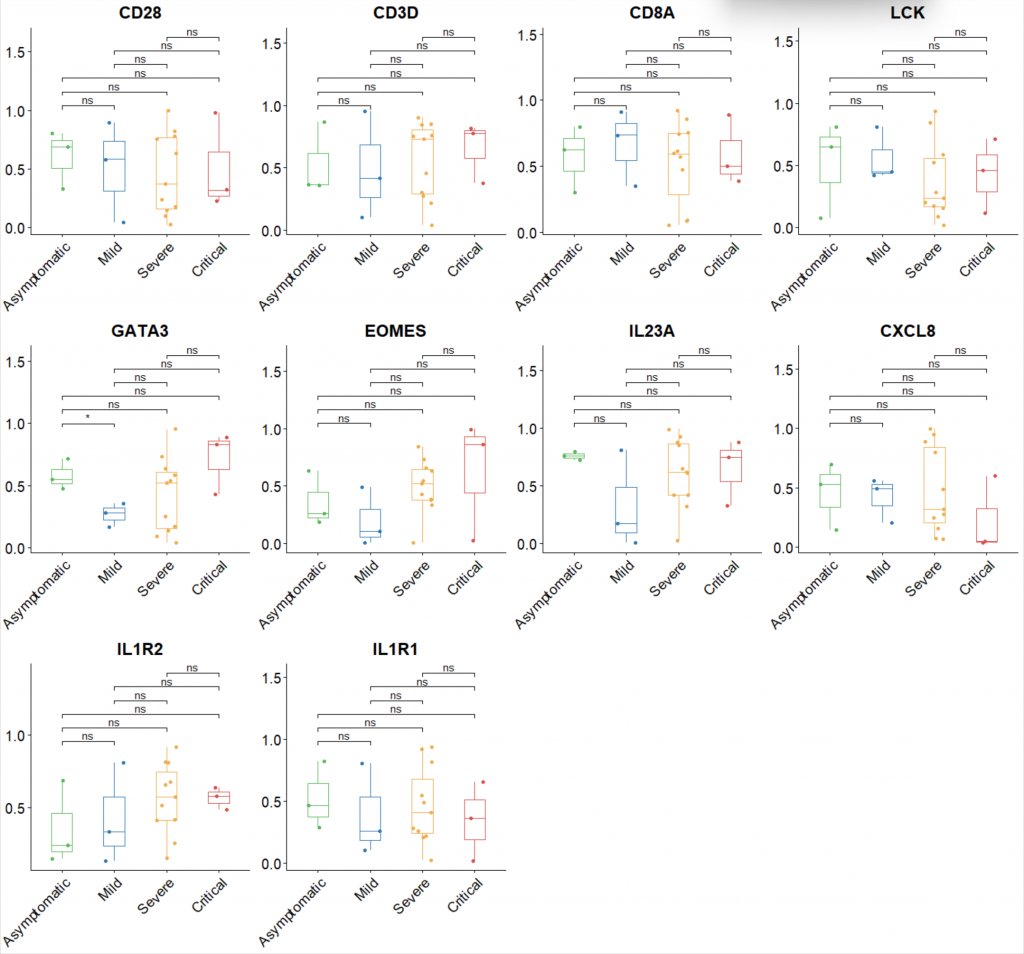
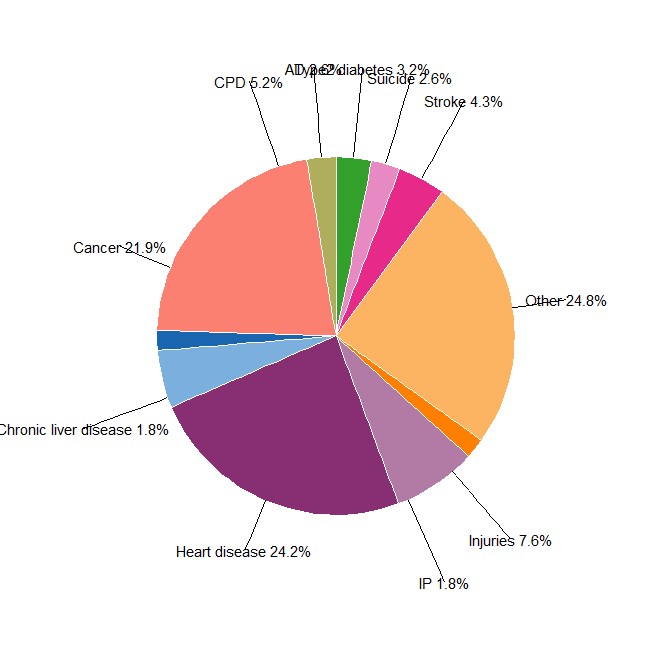
基础图片复现:分组散点箱线图+显著性
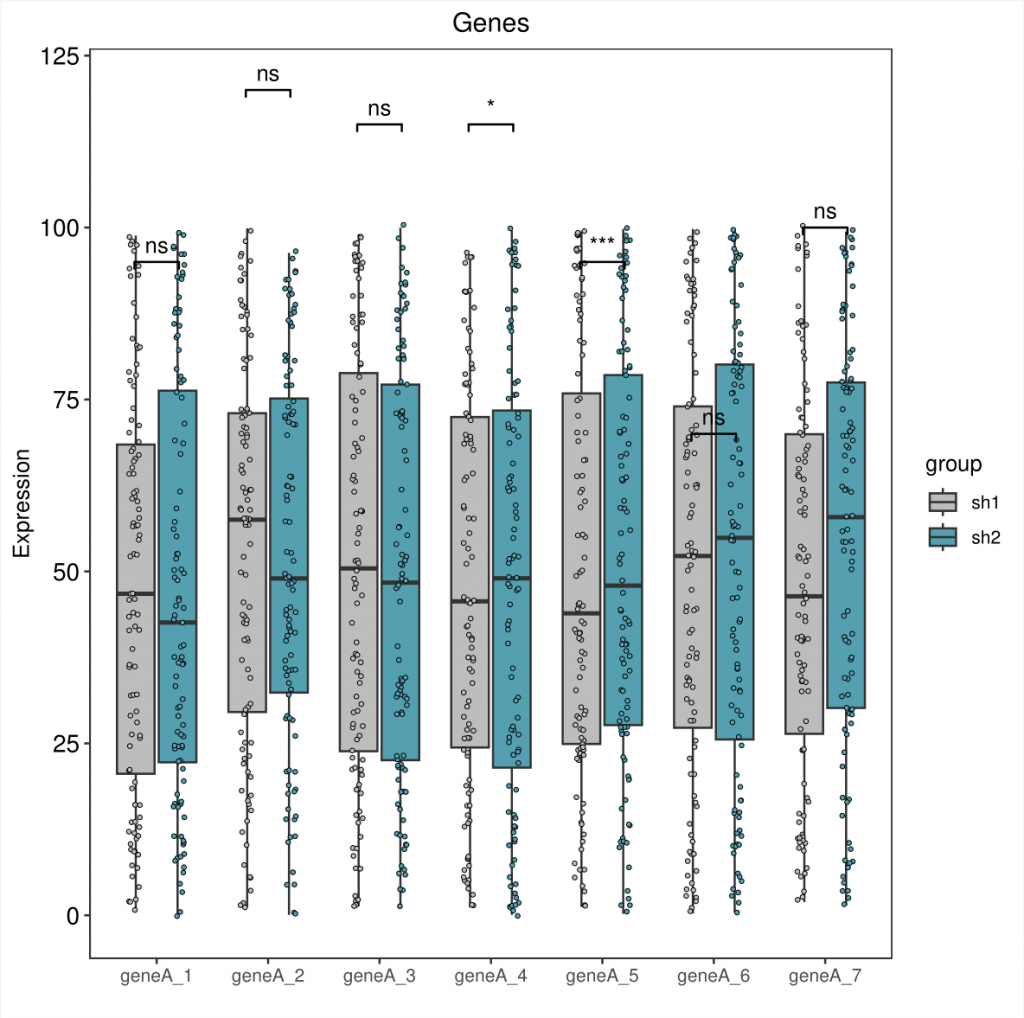
代码主要完成的功能如下:
- 读取两个CSV文件(sh1.csv 和 sh2.csv)sh2_modified sh1_modified。
- 使用tidyr包将宽数据转换为长数据。
- 增加一个分组列。
- 删除包含NA的行。
- 合并两个数据集。
- 使用ggplot2和ggpubr绘制箱线图,并添加显著性标记。
# Set working directory (modify as needed)
# setwd("D:")

# 1. 读取数据
sh1 <- read.csv("sh1_modified.csv",header = T)
sh2 <- read.csv("sh2_modified.csv",header = T)

# 2. 使用tidyr包将宽数据转换为长数据
library(tidyr)
sh1 <- gather(sh1, gene, value, starts_with("geneA_")) # Use starts_with for dynamic column selection
sh1$group <- "sh1"
sh2 <- gather(sh2, gene, value, starts_with("geneA_"))
sh2$group <- "sh2"

# 3. 去除NA的行并合并数据
sh1 <- na.omit(sh1)
sh2 <- na.omit(sh2)
data <- rbind(sh1, sh2)

# 4. 使用ggplot2和ggpubr绘制箱线图,并添加显著性标记
library(ggplot2)
library(ggpubr)

# Basic Boxplot
plot1 <- ggplot(data, aes(fill=group, y=value, x=gene)) +
  geom_boxplot(outlier.shape = NA) +
  geom_jitter(size = 1, shape = 21, color="black", stroke = 0.15, show.legend = FALSE,
              position = position_jitterdodge(jitter.height=0.5, jitter.width = 0.1, dodge.width = 0.8)) +
  labs(title = "Genes", y="Expression", x = "") +
  theme_bw() +
  theme(plot.title = element_text(hjust = 0.5),
        panel.background = element_blank(),
        panel.grid.major = element_blank(),
        panel.grid.minor = element_blank(),
        axis.text.y = element_text(size = 12, color="black")) +
  scale_fill_manual(values = c('grey','#55A1B1'))

# Boxplot with Significance
plot2 <- plot1 +
  stat_compare_means(aes(group=group), method = "t.test", label="p.signif")

# Boxplot with Significance Annotations
plot3 <- plot1 +
  geom_signif(annotations = c("ns","ns","ns","*","***","ns","ns"),
              y_position = c(95,120,115,115,95,70,100),
              xmin = c(0.8,1.8,2.8,3.8,4.8,5.8,6.8),
              xmax = c(1.2,2.2,3.2,4.2,5.2,6.2,7.2),
              tip_length = c(0.01,0.01,0.01,0.01,0.01,0.01,0.01))

# Save plots as PDF
ggsave(filename = "plot1.pdf", plot = plot1)
ggsave(filename = "plot2.pdf", plot = plot2)
ggsave(filename = "plot3.pdf", plot = plot3)
图片展示:
THE END
