高分SCI图片复现:箱线图+散点图
使用示例数据进行,请根据实际需要调整
# 创建虚拟数据:
Bacteroides_A <- runif(50, min = -17, max = -12)
Bacteroides_B <- runif(50, min = -15.5, max = -10)
BMI_A <- runif(50, min = 3.45, max = 4.2)
BMI_B <- runif(50, min = 3.2, max = 4.0)
data <- cbind(Bacteroides_A, BMI_A, Bacteroides_B, BMI_B)

# 加载包:
library(ggplot2)
library(tidyr)

# 对数据进行简单处理:
new_data <- as.data.frame(rbind(data[1:50, 1:2], data[1:50, 3:4]))
colnames(new_data) <- c("Bacteroides", "BMI")
new_data$group <- rep(c("group_A", "group_B"), c(50, 50))
new_data$group2 <- rep(paste("sample", 1:50, sep = ""), 2)

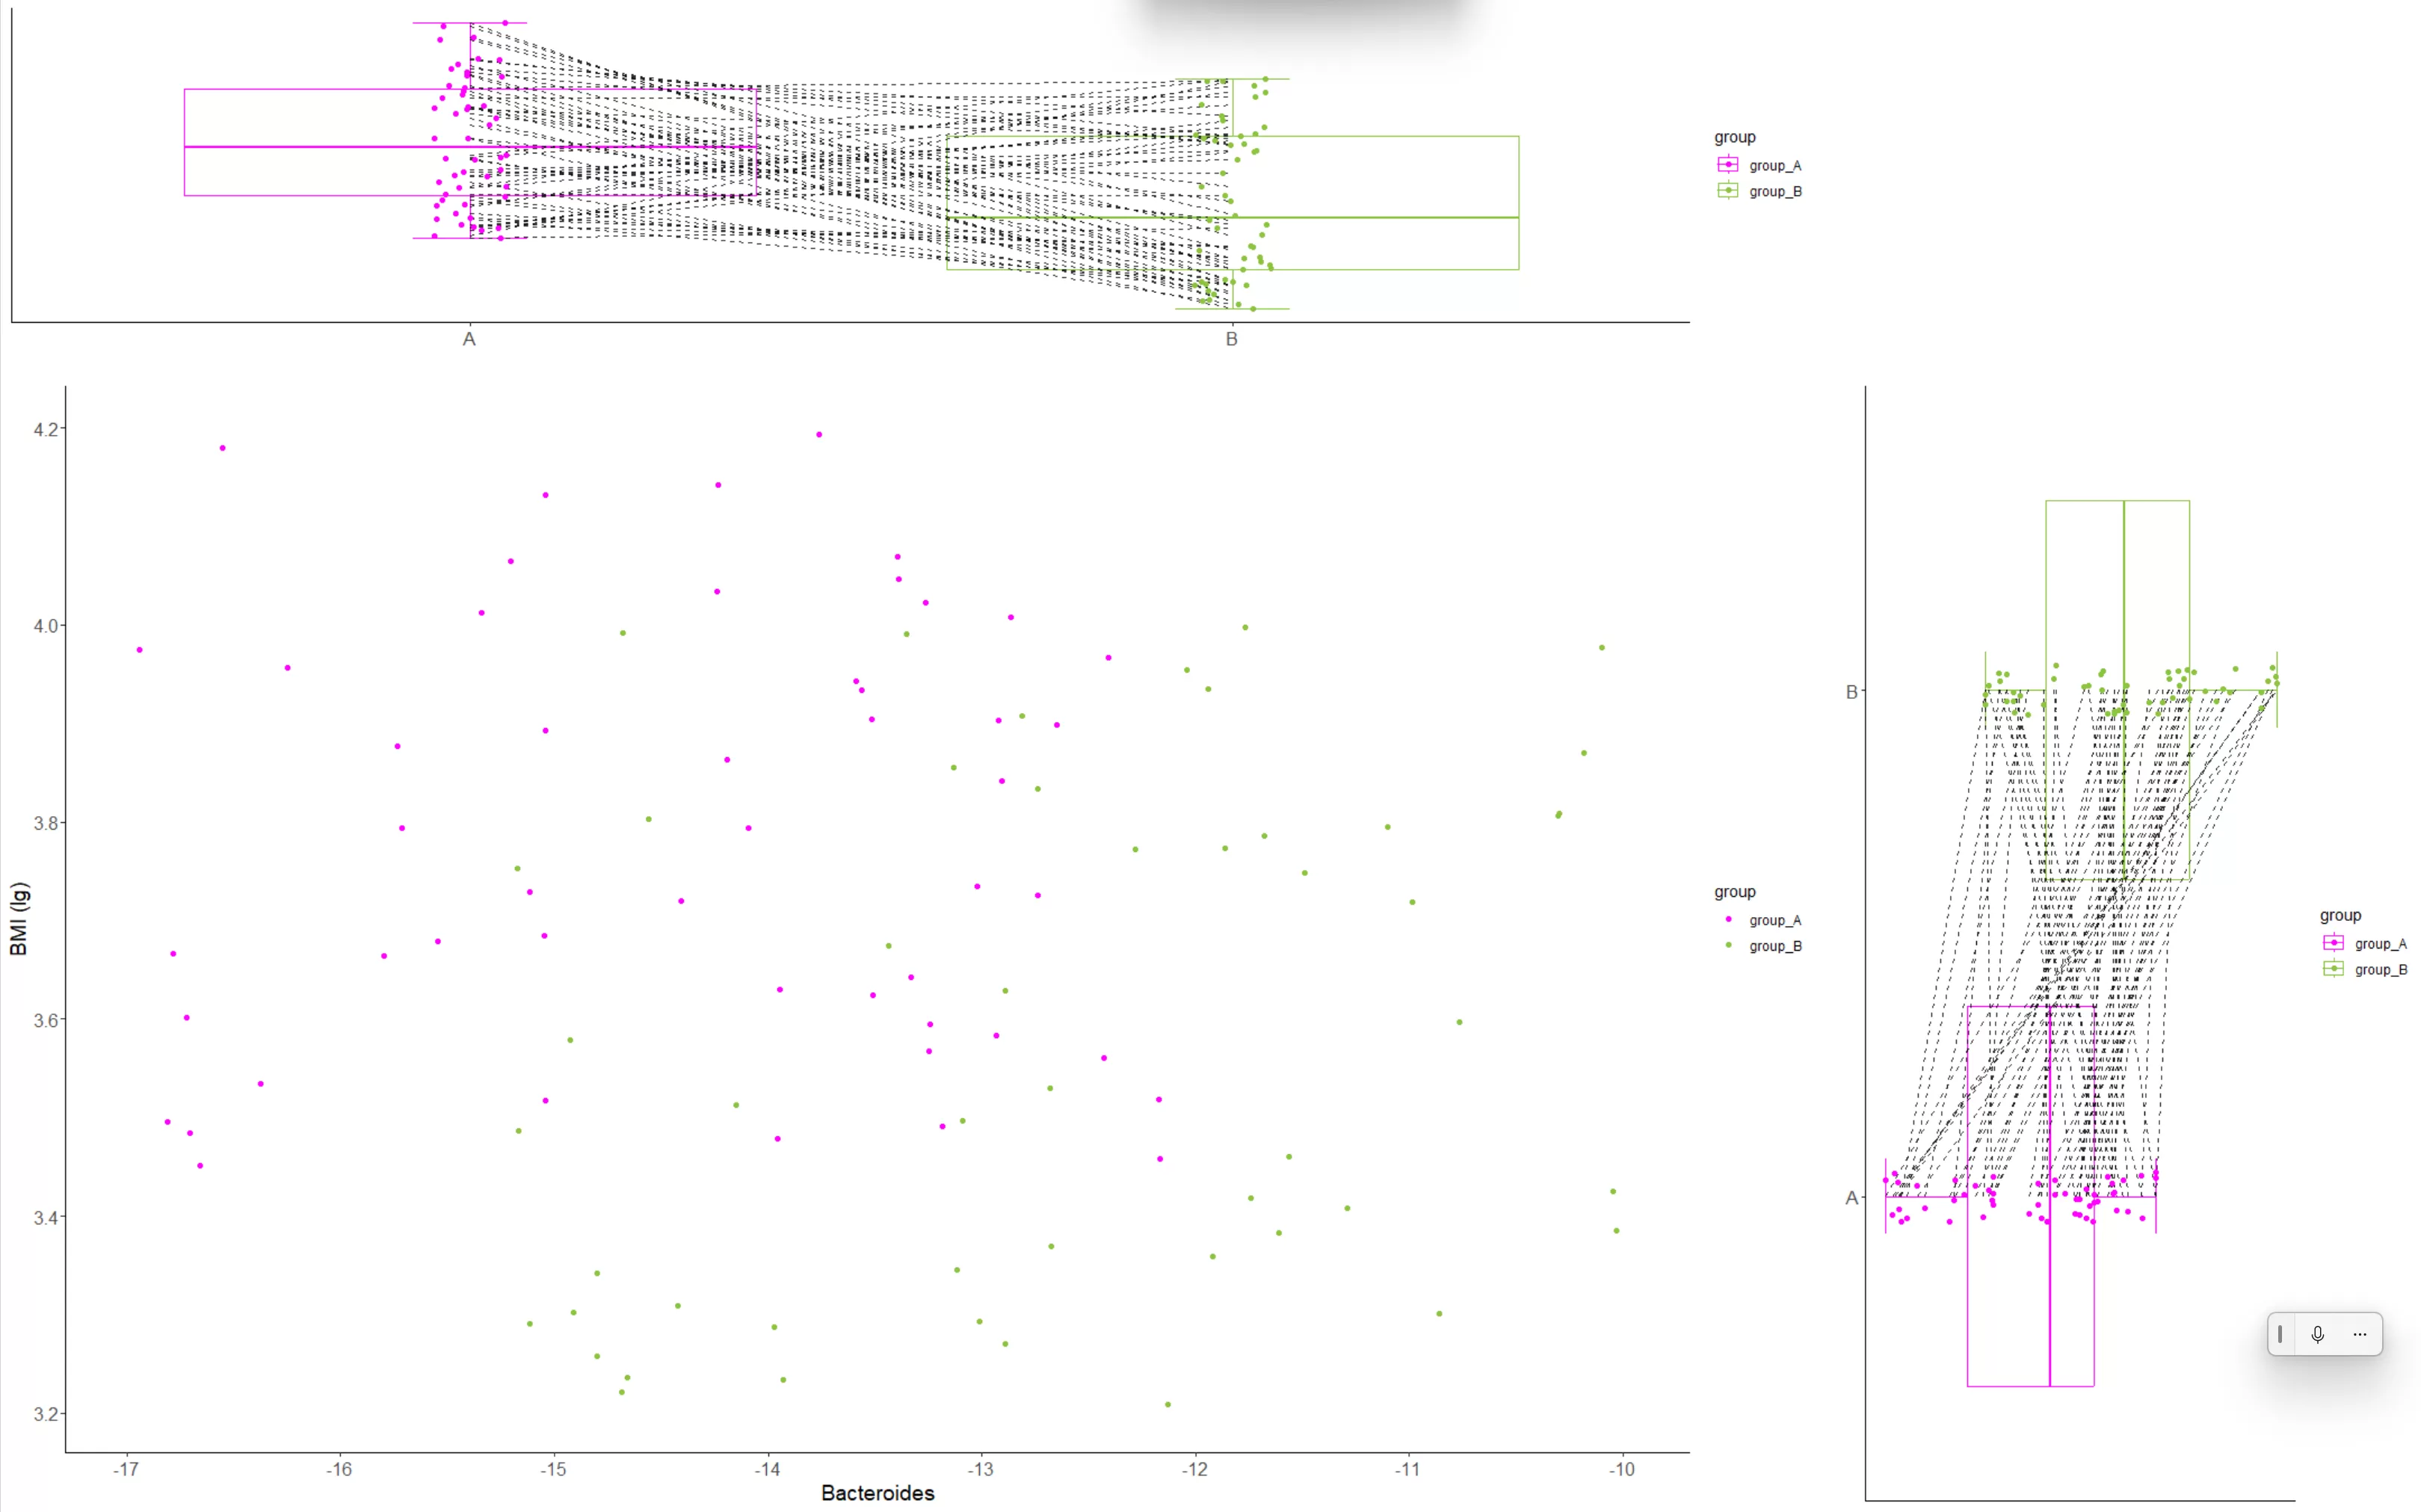
# 散点图和两个箱线图都包含在同一个图中
scatter_plot <- ggplot(new_data) +
  geom_point(aes(Bacteroides, BMI, color = group)) +
  scale_color_manual(values = c(group_A = "#ff00ff", group_B = "#8ac53e")) +
  theme_classic() +
  scale_x_continuous(breaks = seq(-17, -10, 1)) +
  scale_y_continuous(breaks = seq(3.2, 4.2, 0.2)) +
  xlab("Bacteroides") +
  ylab("BMI (lg)") +
  theme(legend.position = 'none')

left_boxplot <- ggplot(new_data, aes(group, BMI)) +
  stat_boxplot(geom = "errorbar", width = 0.15, aes(color = group)) +
  geom_boxplot(aes(color = group), fill = "white") +
  geom_line(aes(group = group2), color = "black", linetype = "dashed", size = 0.2, alpha = 0.8) +
  geom_jitter(aes(color = group, fill = group), width = 0.05, shape = 21) +
  scale_color_manual(values = c(group_A = "#ff00ff", group_B = "#8ac53e")) +
  scale_fill_manual(values = c(group_A = "#ff00ff", group_B = "#8ac53e")) +
  theme_classic() +
  scale_x_discrete(labels = c("A", "B")) +
  scale_y_continuous(breaks = seq(3.2, 4.2, 0.2)) +
  xlab("") +
  ylab("") +
  theme(legend.position = 'none')

down_boxplot <- ggplot(new_data, aes(group, Bacteroides)) +
  stat_boxplot(geom = "errorbar", width = 0.15, aes(color = group)) +
  geom_boxplot(aes(color = group), fill = "white") +
  geom_line(aes(group = group2), color = "black", linetype = "dashed", size = 0.2, alpha = 0.8) +
  geom_jitter(aes(color = group, fill = group), width = 0.05, shape = 21) +
  scale_color_manual(values = c(group_A = "#ff00ff", group_B = "#8ac53e")) +
  scale_fill_manual(values = c(group_A = "#ff00ff", group_B = "#8ac53e")) +
  theme_classic() +
  scale_x_discrete(labels = c("A", "B")) +
  scale_y_continuous(breaks = seq(-17, -10, 1)) +
  xlab("") +
  ylab("") +
  theme(legend.position = 'none') +
  coord_flip()

# 使用gridExtra包将三个图合并到一起
library(gridExtra)

# 以合适的尺寸保存绘图
grid.arrange(scatter_plot, left_boxplot, down_boxplot, ncol = 2, nrow = 2, widths = c(3, 1), heights = c(1, 3))

# 保存绘图
ggsave(filename = "combined_plot.pdf", height = 6, width = 6)
这段代码首先创建了一个名为down_boxplot的箱线图,绘制了Bacteroides数据。然后,我们使用gridExtra包中的grid.arrange函数将三个图像(散点图、左侧箱线图和下方箱线图)组合在一个图像中,并设置了适当的尺寸。最后,我们使用ggsave函数保存合并后的绘图。

优化图片
# 加载所需的库
library(ggplot2)
library(tidyr)
library(gridExtra)
library(cowplot)

# 创建一个新主题,删除背景网格线,并调整坐标轴文字大小
my_theme <- theme_classic() + theme(panel.grid.major = element_blank(),
                                    panel.grid.minor = element_blank(),
                                    axis.text = element_text(size = 12))

# 将散点图的图例添加回来
scatter_plot <- scatter_plot + theme(legend.position = "right")

# 调整左侧箱线图,使其更窄,同时删除y轴标签
left_boxplot <- left_boxplot + my_theme +
  theme(axis.text.y = element_blank(),
        axis.ticks.y = element_blank(),
        axis.title.y = element_blank())

# 调整下方箱线图,使其更短,同时删除x轴标签
down_boxplot <- down_boxplot + my_theme +
  theme(axis.text.x = element_blank(),
        axis.ticks.x = element_blank(),
        axis.title.x = element_blank())

# 创建一个名为“combined_plot”的组合图,其中包含散点图、左侧箱线图和下方箱线图
combined_plot <- ggdraw() +
  draw_plot(scatter_plot, x = 0, y = 0, width = 0.75, height = 0.75) +
  draw_plot(left_boxplot, x = 0, y = 0.75, width = 0.75, height = 0.25) +
  draw_plot(down_boxplot, x = 0.75, y = 0, width = 0.25, height = 0.75)

# 显示组合图
print(combined_plot)

# 保存组合图
ggsave(filename = "further_optimized_combined_plot.pdf", plot = combined_plot, height = 6, width = 6)
在这段优化后的代码中,我们首先创建了一个新的主题my_theme,用于删除背景网格线并调整坐标轴文本大小。接下来,我们将新主题应用于散点图、左侧箱线图和下方箱线图,并相应地调整了它们的尺寸。
为了更直观地将三个图组合在一起,我们使用了cowplot包。我们创建了一个名为combined_plot的组合图,其中包含散点图、左侧箱线图和下方箱线图。我们使用draw_plot函数设置了每个子图在组合图中的位置和大小。
最后,我们显示并保存了优化后的组合图。这将产生一个更美观、比例合适的图像,同时保持直观和美观。

THE END


