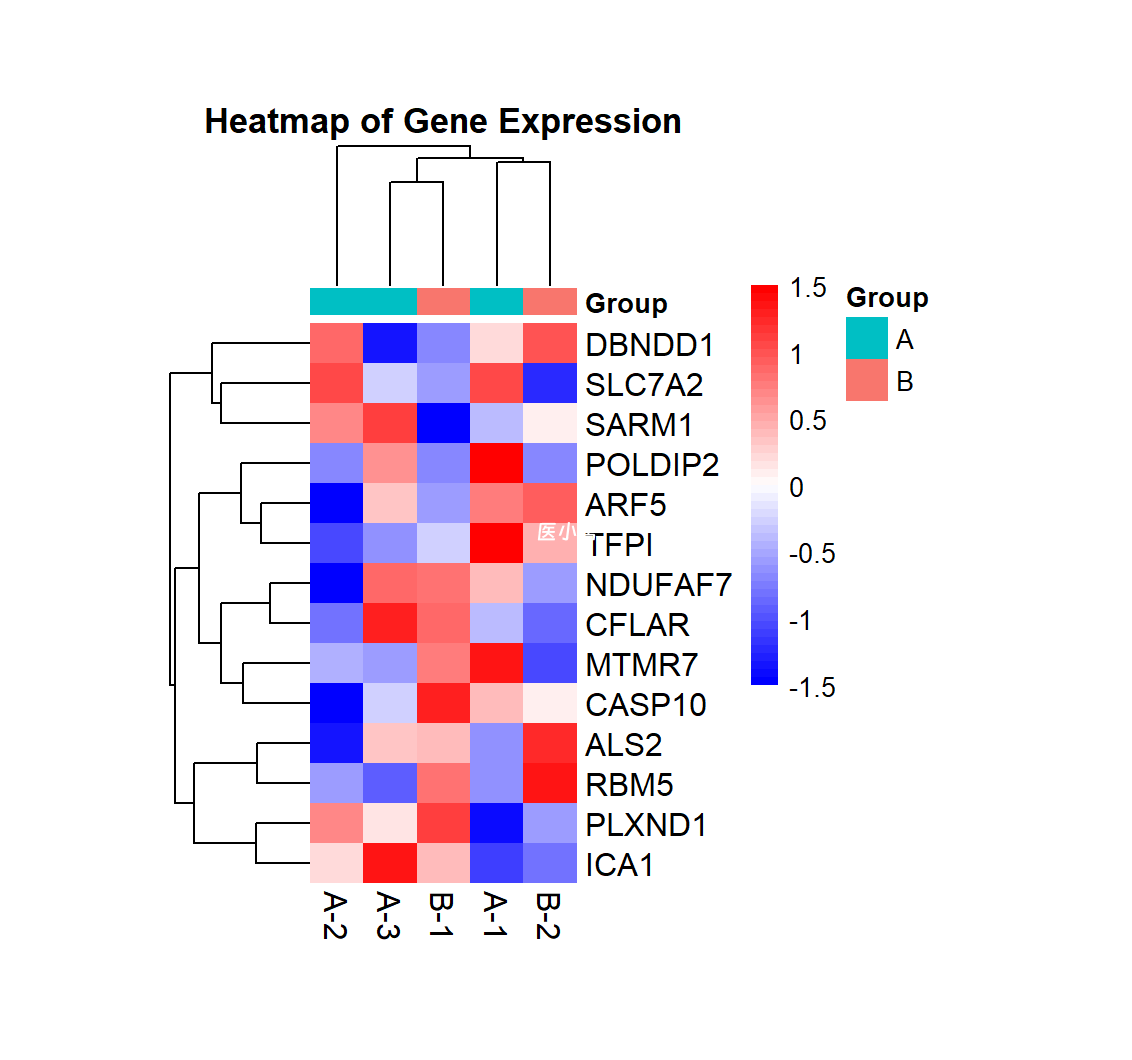
SCI图片复现:复杂热图
从头到尾的完整代码,包括生成示例数据、处理数据、绘制热图及相关注释、绘制柱状图以及保存为 PDF 文件:根据自己数据调整
# 生成数据矩阵
LU_matrix <- matrix(runif(200, 0, 0.5), nrow = 10, ncol = 20)
RD_matrix <- matrix(runif(340, -0.5, 0), nrow = 17, ncol = 20)
RU_matrix <- matrix(runif(20, -0.5, 0), nrow = 10, ncol = 2)
LD_matrix <- matrix(runif(34, 0, 0.5), nrow = 17, ncol = 2)

data <- rbind(cbind(LU_matrix, RU_matrix), cbind(RD_matrix, LD_matrix))

# 生成示例行名和列名
rownames(data) <- paste("Gene", seq(1, nrow(data)), sep = "_")
colnames(data) <- paste("Sample", seq(1, ncol(data)), sep = "_")

# 生成p值矩阵和T_data矩阵
p_data <- matrix(runif(27 * 22, 0, 0.1), nrow = 27, ncol = 22)
T_data <- matrix(runif(27 * 22, 0, 0.1), nrow = 27, ncol = 22)
T_data <- T_data > 0.05

# 显示前几行数据
head(data)

# 加载所需库
library(ComplexHeatmap)
library(circlize)
library(ggplot2)

# 设置颜色
col_fun <- colorRamp2(c(-0.5, -0.1, 0.1, 0.5), c("#5296cc", "#cad5f9", "#fdedf6", "#f064af"))

# 绘制热图并保存为PDF
pdf("Heatmap.pdf", height = 6, width = 7)
Heatmap(data,
        col = col_fun,
        rect_gp = gpar(col = "white", lwd = 1),
        column_dend_height = unit(2, "cm"),
        row_dend_width = unit(2, "cm"),
        row_names_gp = gpar(fontsize = 7, fontface = "italic", col = c(rep("#ff339f", 10), rep("#5facee", 17))),
        column_names_gp = gpar(fontsize = 7),
        cell_fun = function(j, i, x, y, width, height, fill) {
          if (p_data[i, j] < 0.01) {
            grid.text(sprintf("*  ", data[i, j]), x, y, gp = gpar(fontsize = 8))
          } else if (p_data[i, j] < 0.05) {
            grid.text(sprintf("+   ", data[i, j]), x, y, gp = gpar(fontsize = 6))
          } else {
            grid.text(sprintf("", data[i, j]), x, y, gp = gpar(fontsize = 6))
          }
          if (T_data[i, j]) {
            grid.text(sprintf("   #", data[i, j]), x, y, gp = gpar(fontsize = 6))
          } else {
            grid.text(sprintf("", data[i, j]), x, y, gp = gpar(fontsize = 6))
          }
        },
        show_heatmap_legend = FALSE,
        column_dend_reorder = FALSE
)

# 图例参数
lgd <- Legend(col_fun = col_fun,
              at = c(-0.5, 0, 0.5),
              title = "Spearman's correlation",
              legend_height = unit(2, "cm"),
              title_position = "topcenter",
              title_gp = gpar(fontsize = 8),
              labels_gp = gpar(fontsize = 8),
              direction = "horizontal",
              grid_height = unit(4, "mm")
)

# 绘制图例
draw(lgd, x = unit(0.9, "npc"), y = unit(0.95, "npc"))

dev.off()

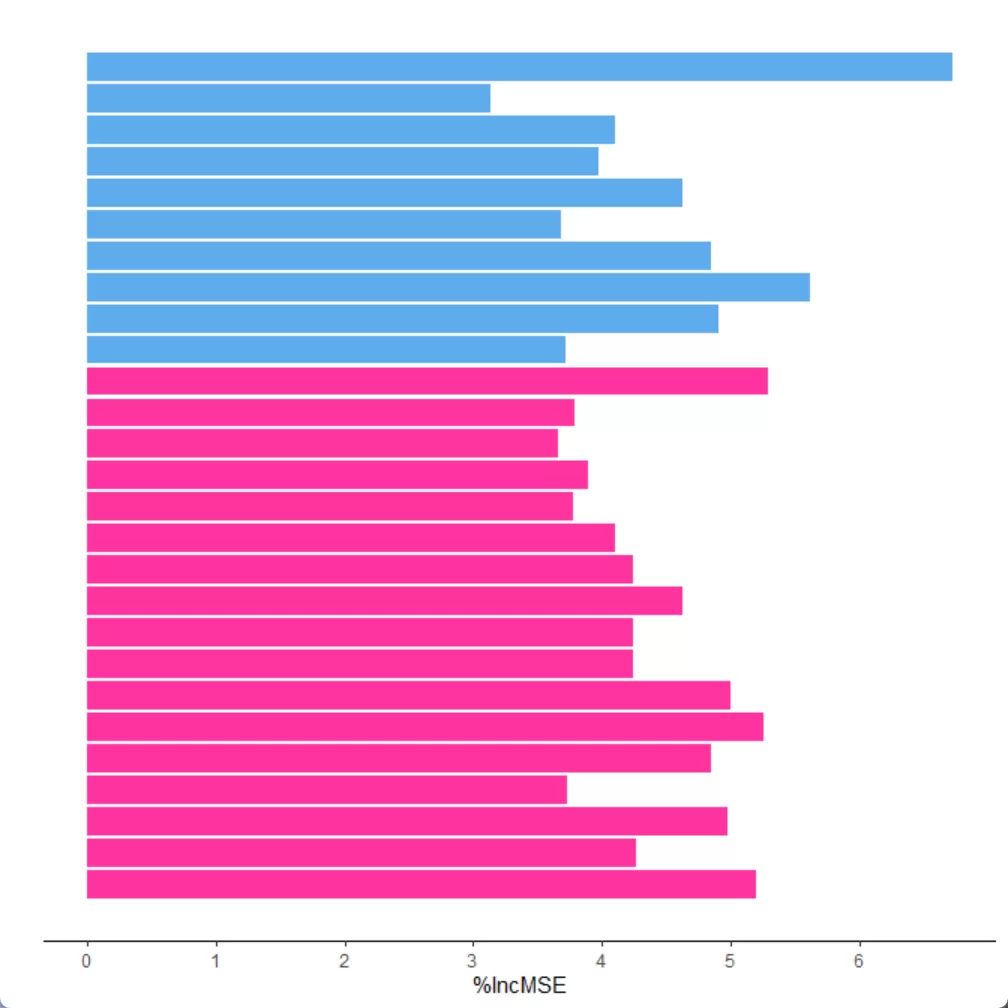
# 添加柱状图
bar_data <- as.data.frame(rowSums(data))
colnames(bar_data) <- "lncMSE"
bar_data$group <- "Pos"
bar_data$group[which(bar_data$lncMSE < 0)] <- "Neg"

ggplot(data = bar_data) +
  geom_bar(aes(x = rev(1:27),
               y = abs(lncMSE), fill = group), stat = "identity") +
  scale_fill_manual(values = c("#ff339f", "#5facee")) +
  coord_flip() +
  xlab("") +
  ylab("%lncMSE") +
  theme_classic() +
  theme(legend.position = "none",
        axis.ticks.y = element_blank(),
        axis.text.y = element_blank(),
        axis.line.y = element_blank()) +
  scale_y_continuous(breaks = c(0:6))

ggsave("barplot.pdf", height = 6, width = 2.5)

THE END
