R语言基础绘图:直方图
如何创建和自定义直方图。请按照以下步骤操作:
- 安装和加载所需的包: 要创建直方图,我们需要使用ggplot2包。如果您尚未安装,请使用以下命令安装:
install.packages("ggplot2")
然后在脚本中加载包:
library(ggplot2)
- 加载数据: 在这里,我们将使用R内置的数据集“mtcars”。要加载此数据集,请运行以下命令:
data(mtcars)
- 创建简单的直方图: 现在,我们将使用ggplot2包创建一个简单的直方图。我们将使用mtcars数据集中的“mpg”(英里每加仑)列来绘制直方图:
basic_histogram <- ggplot(mtcars, aes(x=mpg)) + geom_histogram()

print(basic_histogram)
- 自定义直方图: 我们可以通过更改bin宽度、颜色和填充来自定义直方图:
custom_histogram <- ggplot(mtcars, aes(x=mpg)) +

  geom_histogram(binwidth=2, color="black", fill="blue") +

  labs(title="Miles Per Gallon Histogram",

       x="Miles per Gallon",

       y="Frequency")

print(custom_histogram)
在这里,我们更改了bin宽度为2,设置了边框颜色为黑色,填充颜色为蓝色。我们还添加了标题和轴标签。
- 更改主题: 我们可以使用不同的预设主题或创建自定义主题。在这个例子中,我们将使用预设主题“theme_minimal()”:
themed_histogram <- custom_histogram + theme_minimal()

print(themed_histogram)

在这个R语言直方图教程中,我们将使用现实生活中的一个应用实例来创建和自定义直方图。我们将分析某公司员工的年龄分布。以下是一个假设的员工年龄数据集:
# 假设的员工年龄数据

employee_age <- c(22, 25, 28, 30, 32, 35, 40, 44, 48, 50, 52, 55, 58, 60)
- 加载必要的包和数据: 首先,我们需要安装并加载ggplot2包(如果尚未安装),并准备数据集:
# 安装并加载ggplot2包

install.packages("ggplot2")

library(ggplot2)
# 假设的员工年龄数据

employee_age <- c(22, 25, 28, 30, 32, 35, 40, 44, 48, 50, 52, 55, 58, 60)
- 创建直方图: 我们将使用ggplot2包创建员工年龄分布的直方图:
age_histogram <- ggplot(data.frame(Age=employee_age), aes(x=Age)) + geom_histogram(binwidth=5)

print(age_histogram)
这里我们设置了bin宽度为5,将年龄分为5岁的区间。
- 自定义直方图: 我们可以自定义直方图的颜色、标题和轴标签:
custom_age_histogram <- age_histogram +

  geom_histogram(binwidth=5, color="black", fill="lightblue") +

  labs(title="Employee Age Distribution",

       x="Age",

       y="Frequency")

print(custom_age_histogram)
- 应用主题: 我们可以应用一个预设主题,例如“theme_minimal()”:
themed_age_histogram <- custom_age_histogram + theme_minimal()

print(themed_age_histogram)
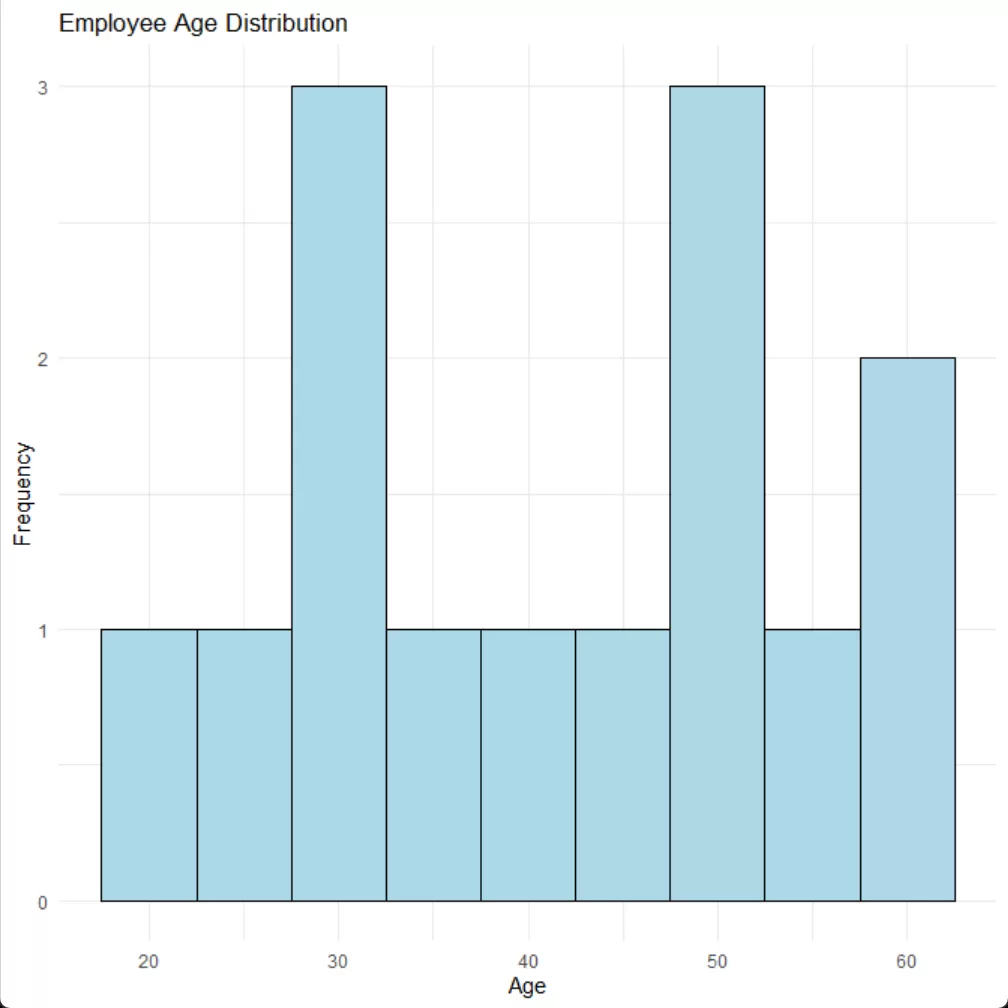
这个例子展示了如何使用R语言和ggplot2包分析现实生活中的数据。通过创建和自定义直方图,我们可以更好地了解员工年龄分布情况。
THE END
